SST Diagnostic
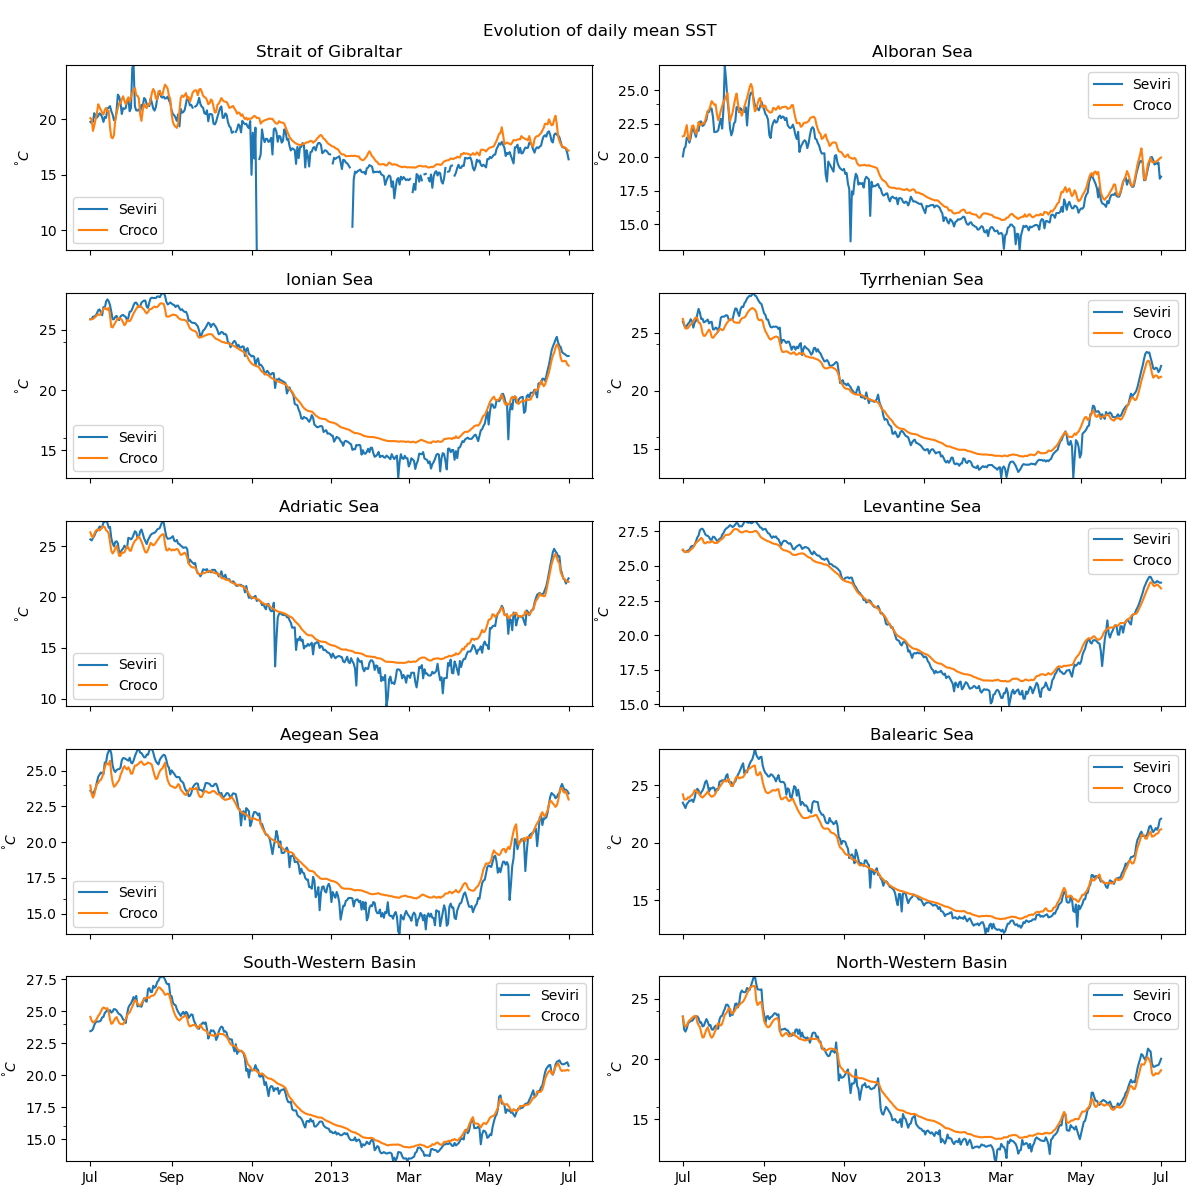
Here we compute some statistics on both Sea surface temperature from Croco and from SEVRI product
The statistics have been computed over a period of 1 year between July 2012 and July 2013.
SEVIRI is described here :
https://podaac.jpl.nasa.gov/dataset/SEVIRI_SST-OSISAF-L3C-v1.0
List of diagnostics
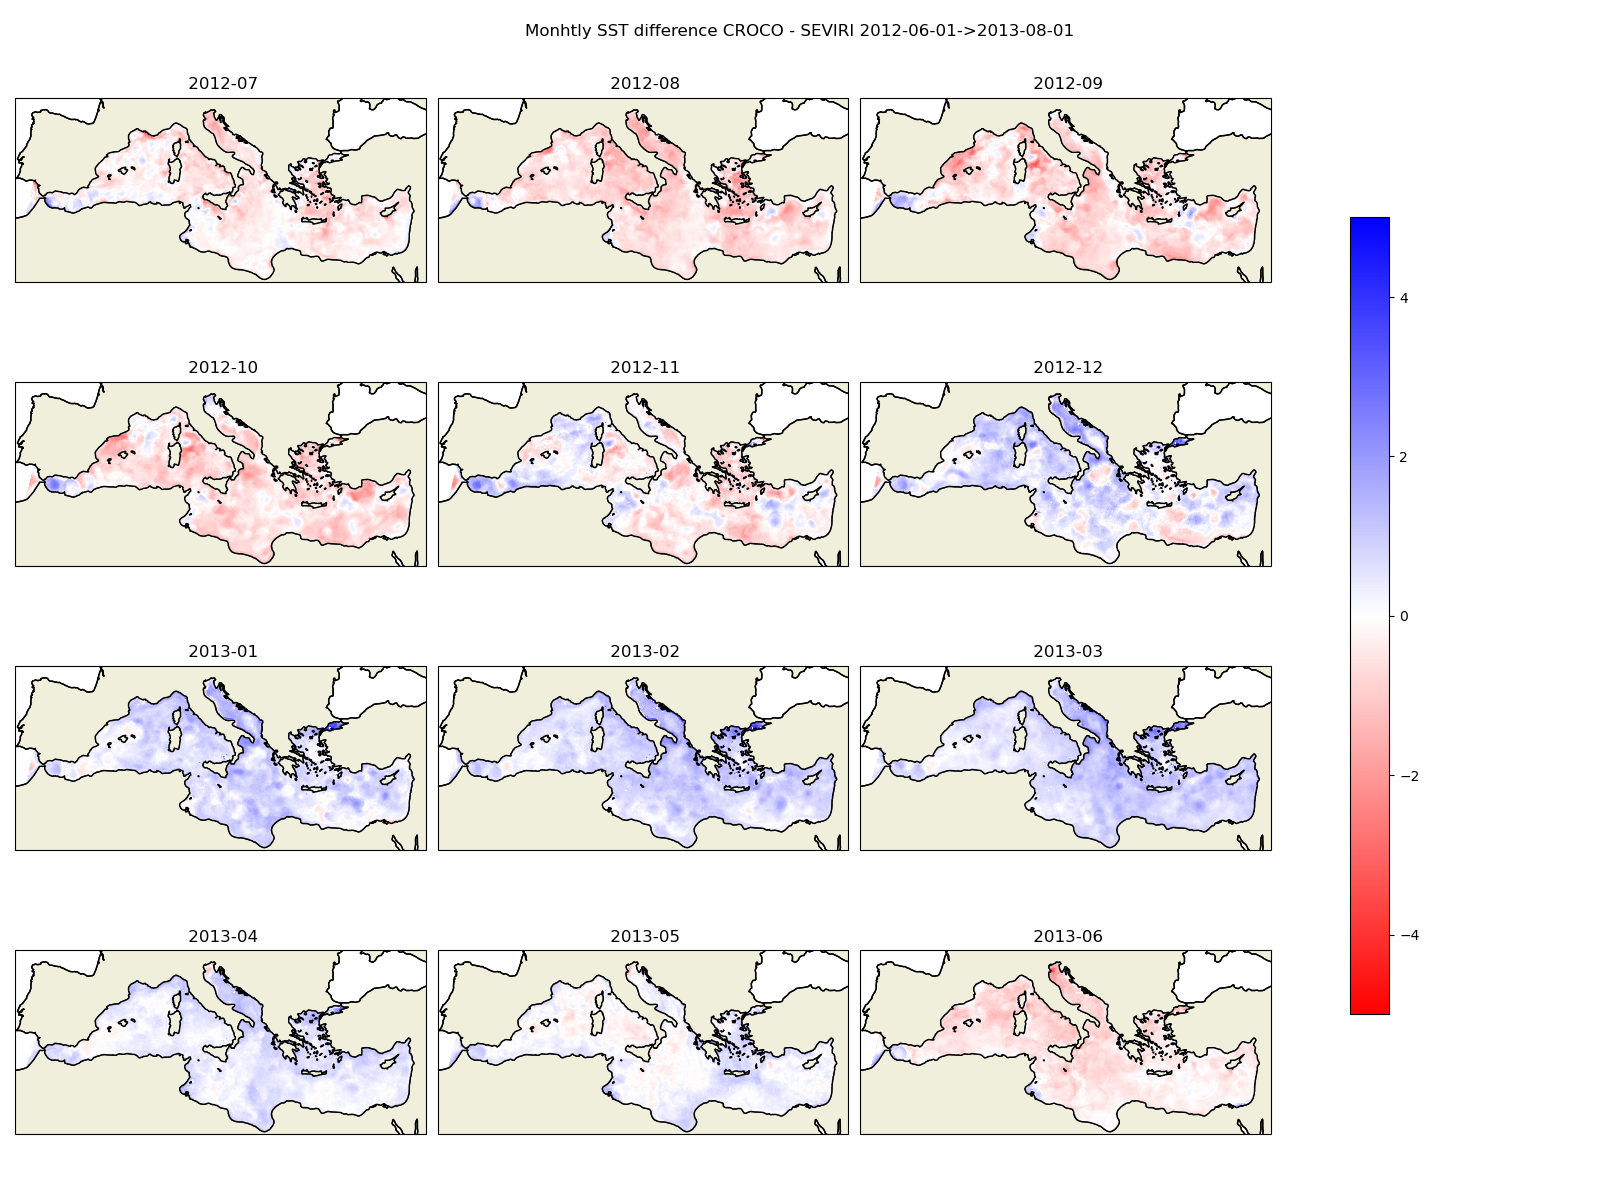
Monthly average comparison
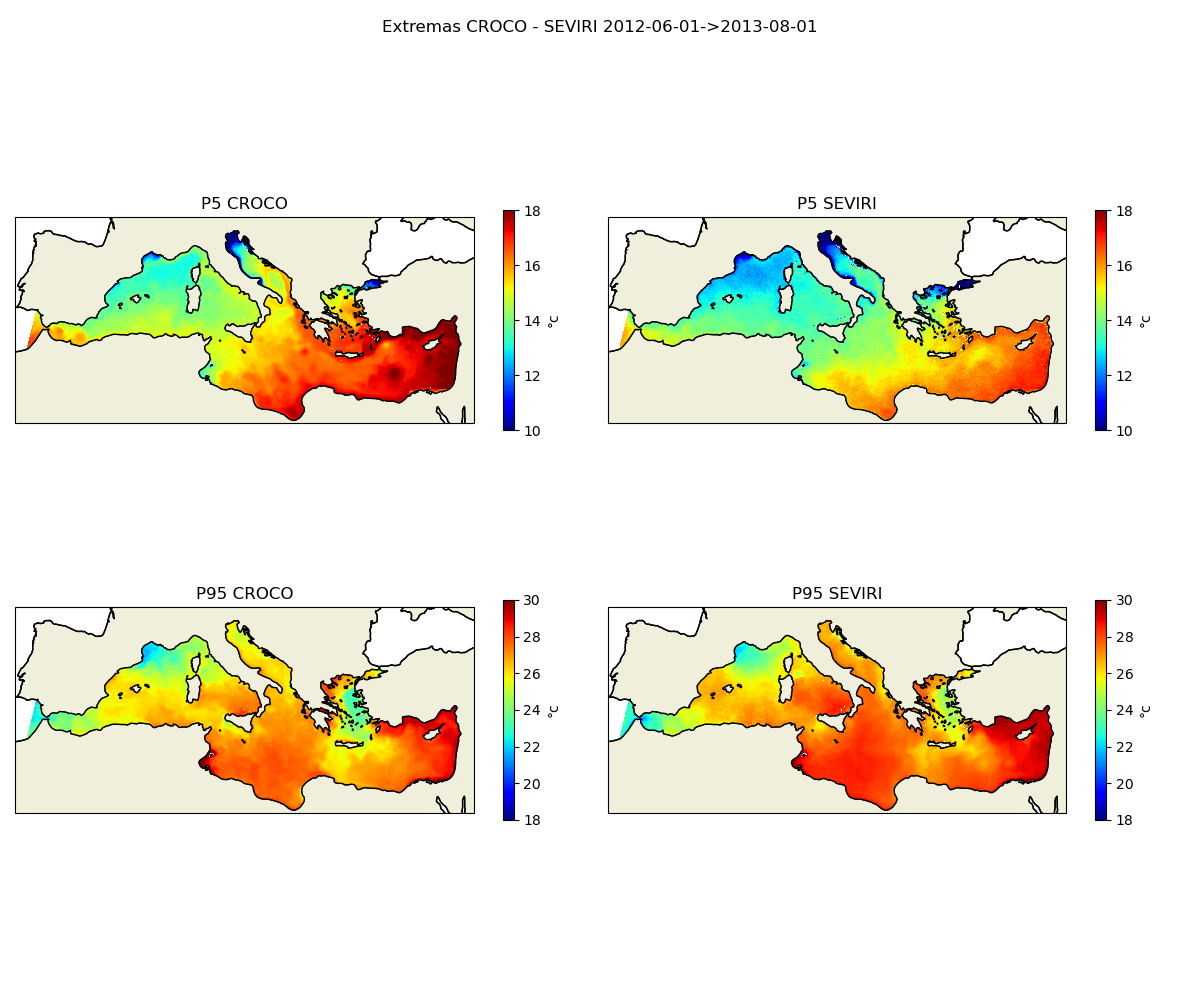
Extrema (percentiles 5 and 95) comparison over the year
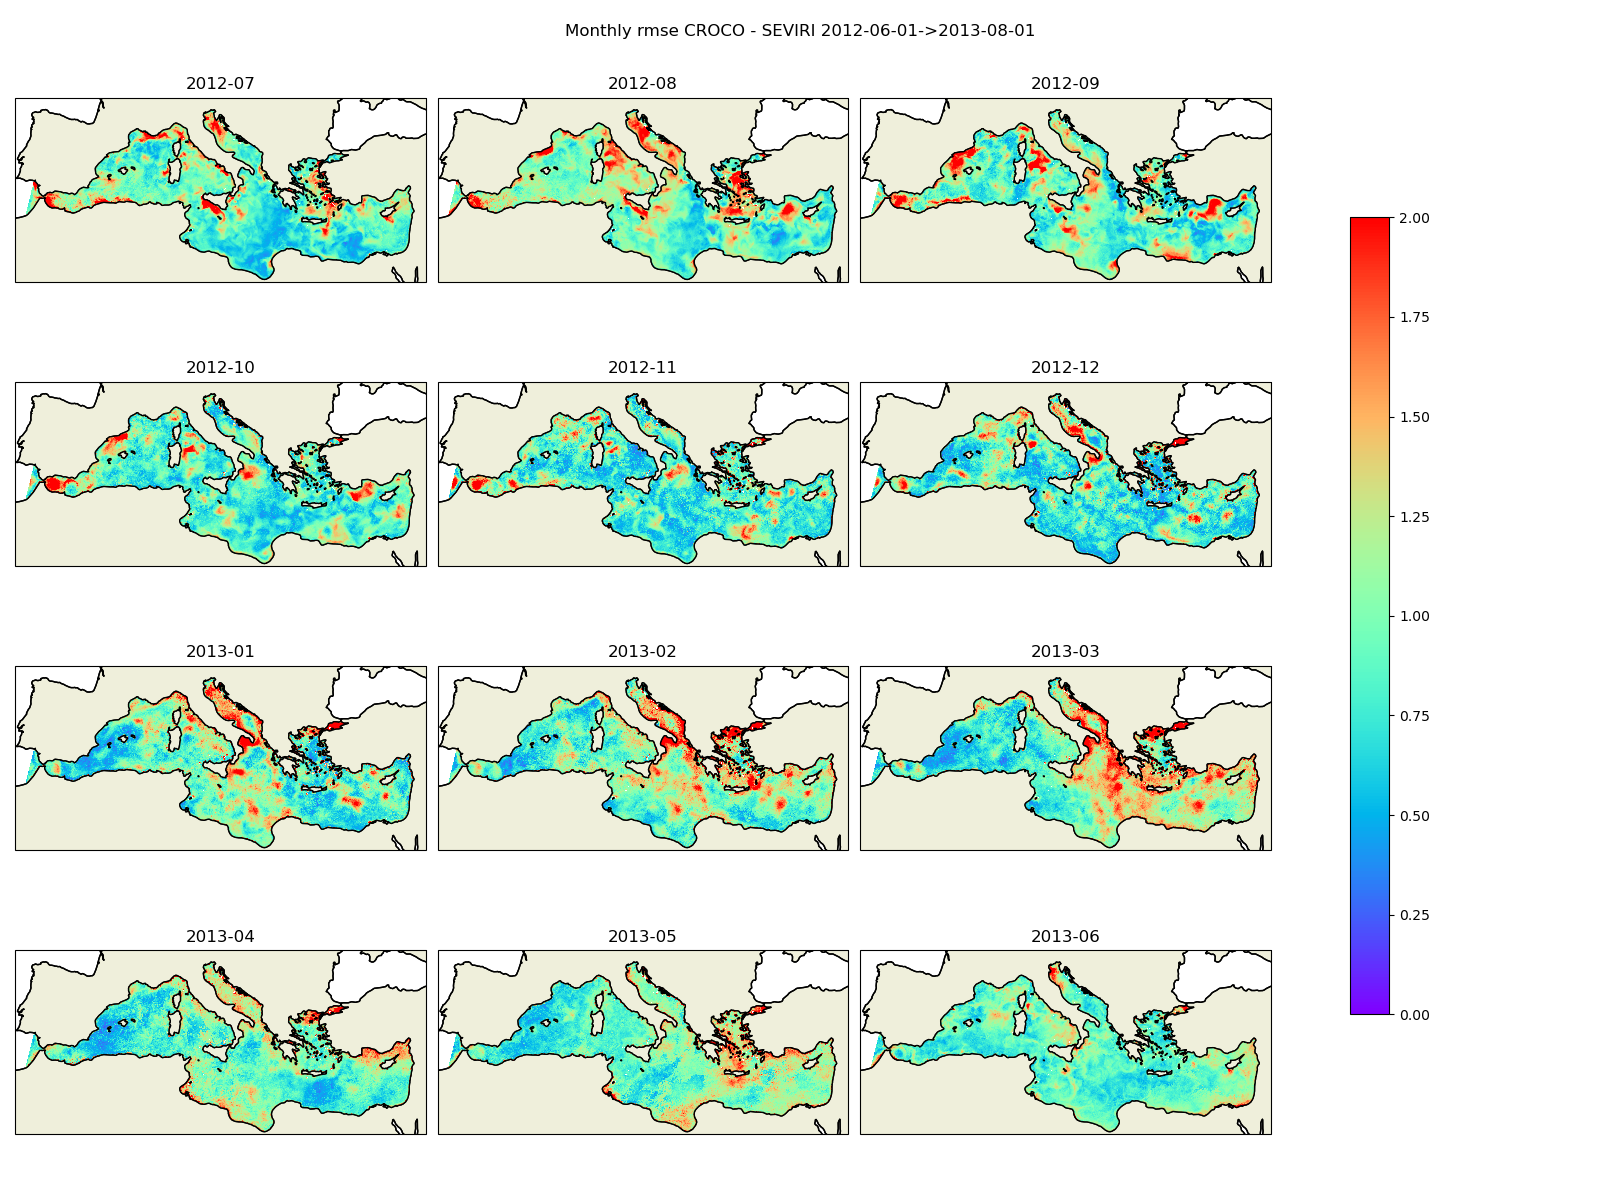
Root Mean Square Error computed monthly
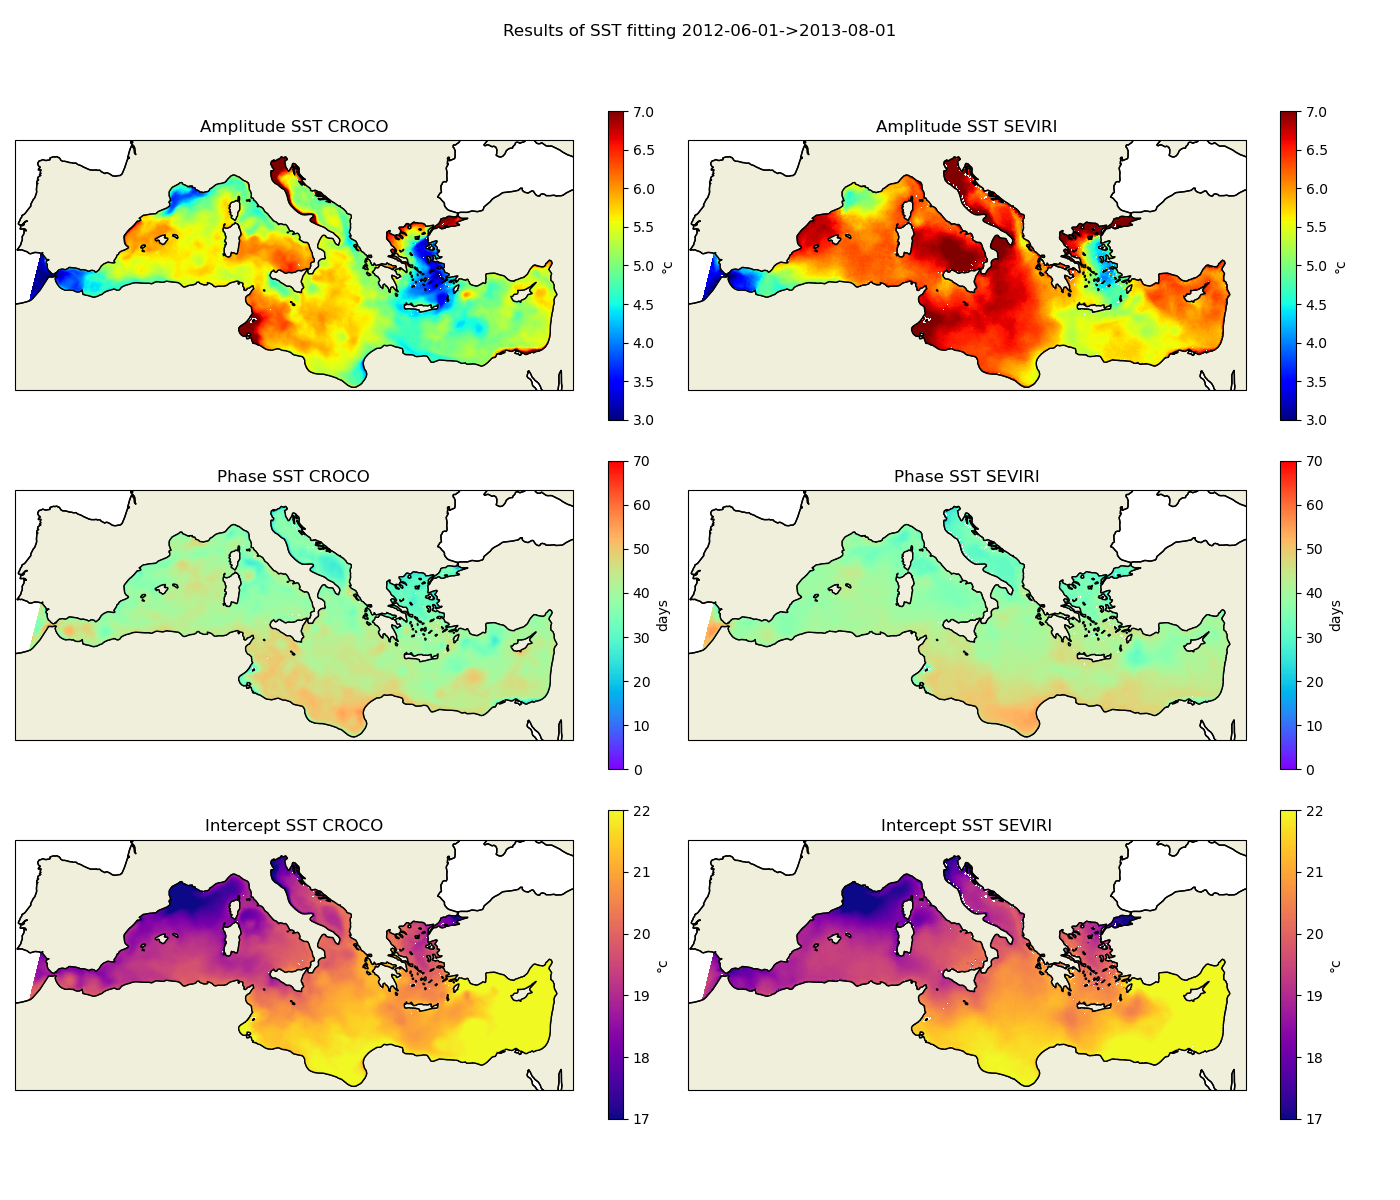
Fitting of the SST on a function and compare the terms between Croco and Seviri
(1)The parameters of the function allow to compare differents components of the SST and show the skills of the model.
a is the annual amplitude
Ta is annual period
phi is phase lagging from the begining of simulation
b is trending term reprensting the inter annual variability
c is the annual mean around which the SST is varying
What scripts ?
calc_save_sst_stats.ipynb is the notebook which compute the statistics and save the results as a netcdf file
plot_sst.ipynb is the notebook which read the intermediate files and do the plots